

Our SaaS platform combines a self-organising software, based on the principles of natural ecosystems, with mathematical modelling, machine learning and advanced 2D and 3D visualisation to create an agile platform that can dynamically adapt to new data and new demands. This provides the adaptive discovery and intelligence-building required to drive insight, forecasting and visualisation in today’s dynamic information landscapes.
Background
The majority of what we call ‘Classical’ Business Intelligence platforms define static relationships between enterprise databases and a common data warehouse, then handling text documents and web searches separately from the main show – whilst they help break down interdepartmental information silos, they tend to create new ones based on the nature of the data. They then depend on largely fixed analytic models to carry out periodic and prescriptive processes. That’s fine if you operate in a slow-changing business environment: it doesn’t however help when you need to surface and analyse hitherto unknown or rapidly changing threats and opportunities.
Features
Our software helps break the barriers between data sources and data classes within enterprises, between enterprises and the outside world and between periodic and real-time data. By doing so, we create new opportunities for enterprises to understand and adapt to our ever-changing world. We achieve this through:
- The ability to ingest and integrate diverse sources of data in many formats, from ground surveys to narrative reports, satellite data and sensor networks. Dynamic and adaptive tasking across these disparate data sources, allows the system to respond immediately to changes in its wider data environment
- Our analytic and forecasting modules. These extract features from the data, to discover and forecast, rather than just making assumptions about the causes of patterns, trends and relationships. This enables our system to proactively identify changes that may prove to be important, whether that’s a new variant emerging of Covid-19 or emerging threats to a supply chain
- Finally, we use those discovered patterns to drive inferential correlation, where we use machine learning and self-organising software to look for and present hitherto unsought relationships within and between diverse data sets
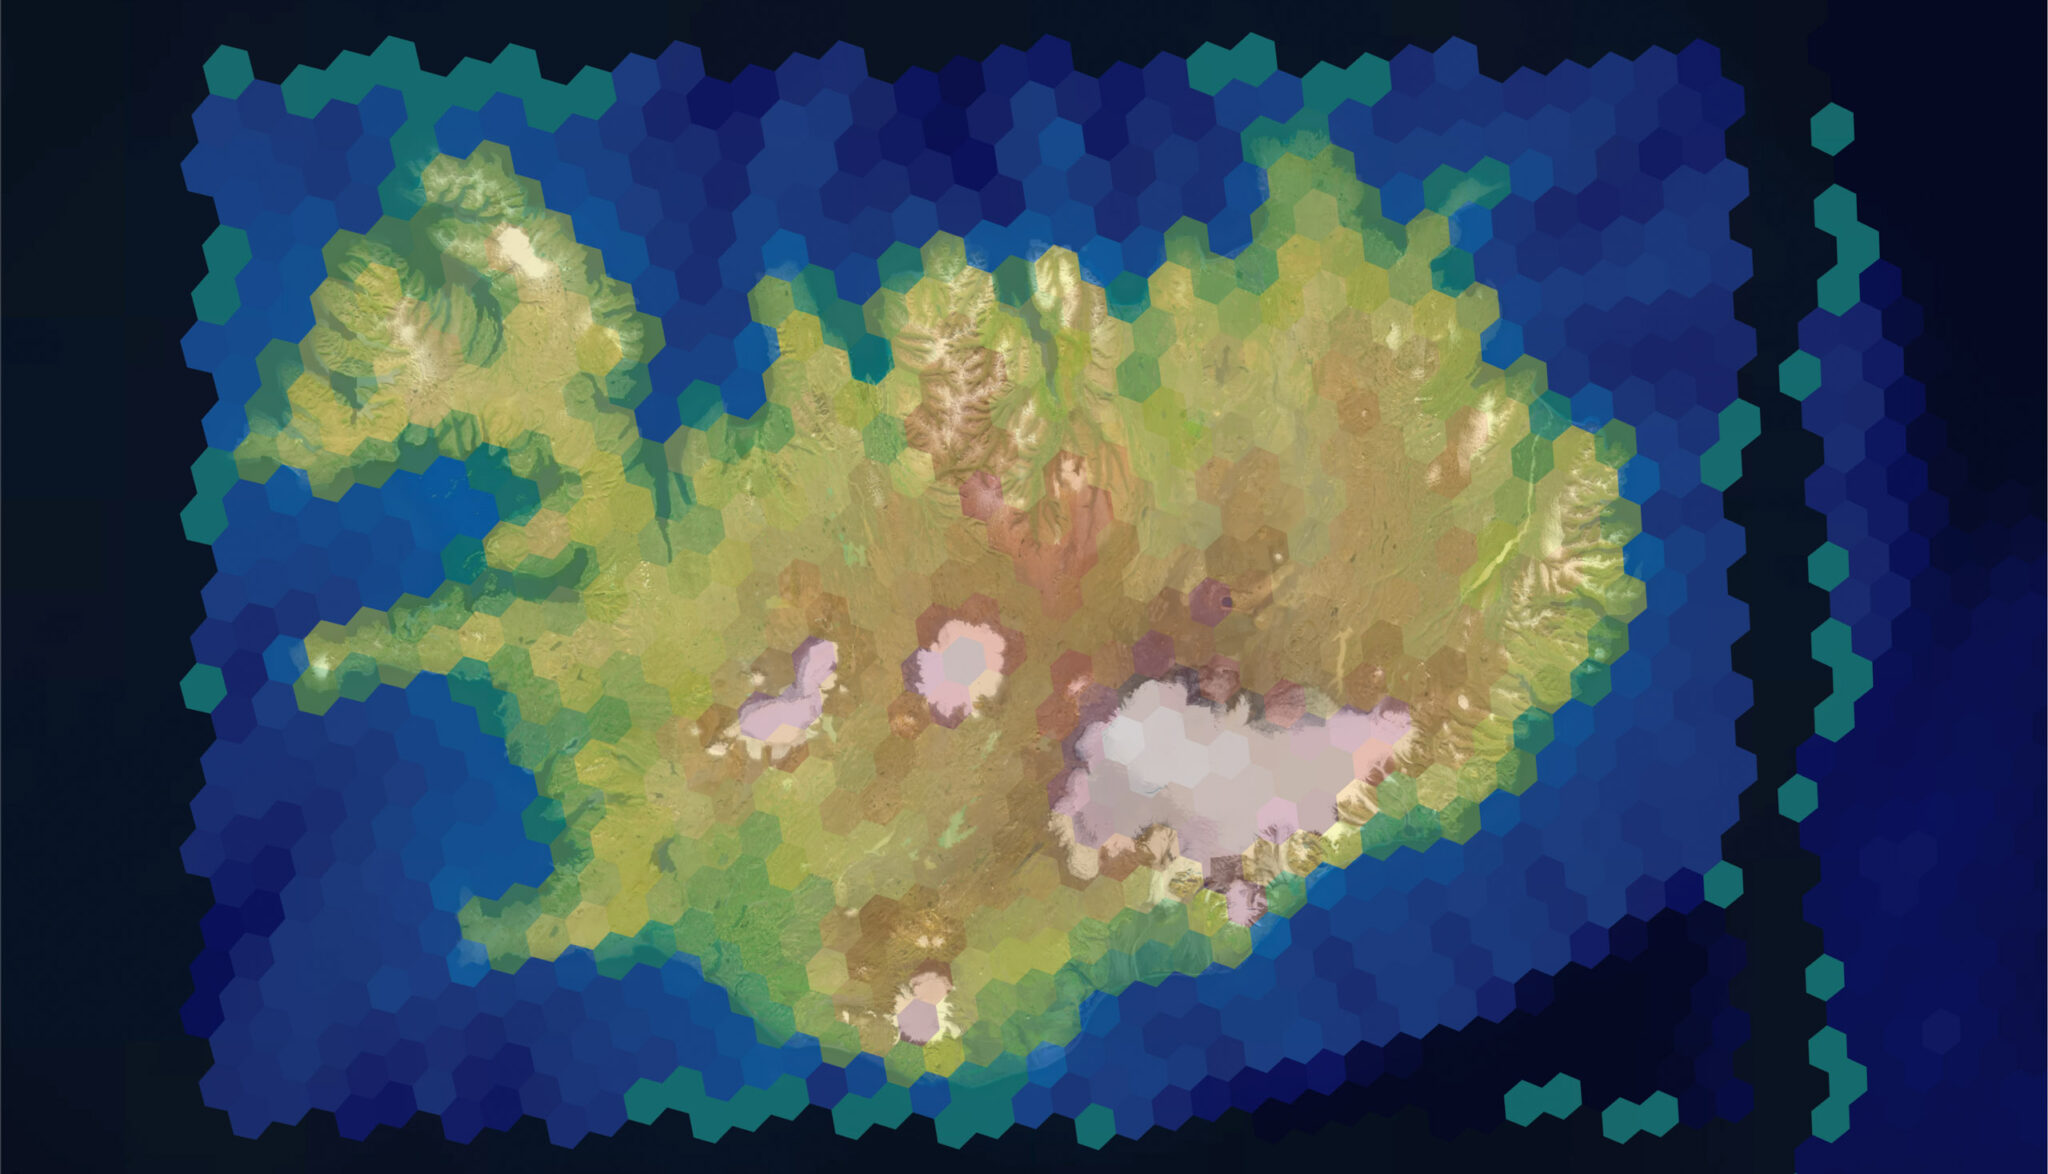
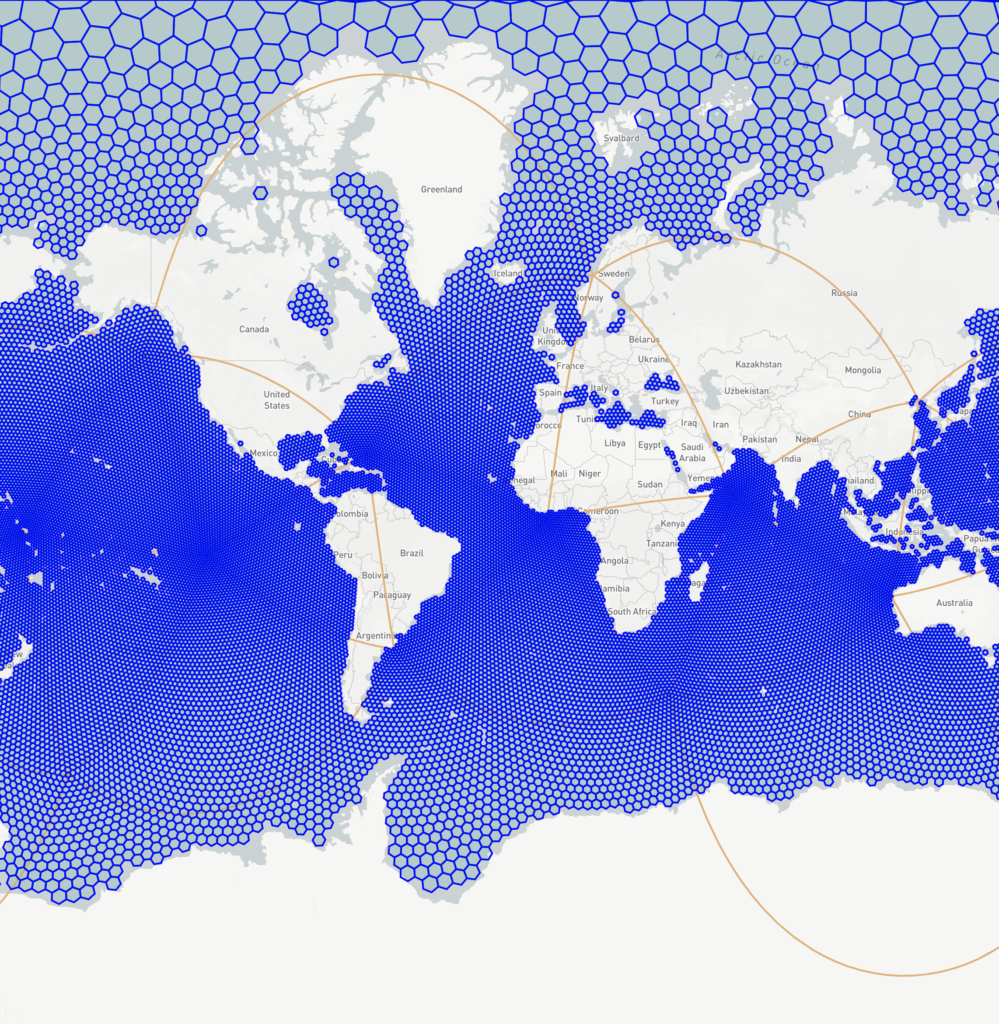
All of these then feed our visualisation tools, allowing the rapid creation of 2D and 3D dashboard, exploratory tools, landscapes and immersive experiences.